|
The graph is generated using the ImagickDraw drawing features. Since the ImagickLineGraph class extends the ImagickDraw class the instance of it can be passed directly to the Imagick::drawImage method.
The ImagickDraw class behaves a little like a ”drawing stack”; you can perform multiple operations on the object and then render the operations on a canvas. Operations like rotate and translate take affect on all drawing operations executed after them.
<?php
class ImagickLineGraph extends ImagickDraw
{
/* Maximum value in the graph */
public $maxValue = 0;
/* Graph data */
private $values;
/* how large steps to take on the y axis values */
private $yValueStep;
private $yStepPixels;
/* The canvas to draw the graph on*/
private $canvas;
/* Amount of steps on the left hand side */
private $amount;
/* The size of the graph viewport */
private $viewPortSize;
public function __construct( array $values )
{
/* Loop trough values and find the max value */
foreach ( $values as $key => $value )
{
if ( $value['value']> $this->maxValue )
{
$this->maxValue = $value['value'];
}
}
/* Set the values into a property */
$this->values = $values;
/* How large steps to take on the left hand side values */
$this->yValueStep = 20;
$this->yStepPixels = 20;
/* Create the horizontal lines */
$this->createHorizontalLines();
/* Create the captions for the values */
$this->createCaptions();
/* Create the polyline that represents the values */
$this->createGraphLine();
}
private function createHorizontalLines()
{
/* The amount of vertical lines to draw */
$this->amount = ceil( $this->maxValue / $this->yValueStep );
/* Use zero based origo but render it a bit lower */
$this->translate( 0, 20 );
/* Set the viewport */
$this->viewPortSize = $this->amount * $this->yStepPixels;
/* Loop trough the amount of values.. */
for ( $i = 0 ; $i <= $this->amount; $i++ )
{
/* Y position on the image */
$yPos = $this->yStepPixels * $i;
/* Draw a horizontal line*/
$this->line( 50, $yPos, 490, $yPos );
/* Create line for this value */
$this->annotation( 20, $this->viewPortSize - $yPos, $yPos );
}
}
private function createCaptions()
{
/* Store the line coordinates to this array */
$this->polylineCoordinates = array();
$xStep = 500 / count( $this->values );
/* Temporary imagick object to use to get font metrics */
$im = new Imagick();
/* Loop trough values.. */
foreach ( $this->values as $key => $value )
{
/* The position for the vertical lines */
$pos = 50 + ( $xStep * $key ) + 30;
/* Query the text properties for the caption */
$properties = $im->queryFontMetrics( $this, $value['caption'] );
/* Place the text in the middle of the vertical line */
$tPos = $pos - ( $properties['textWidth'] / 2 );
/* Write the caption, one step below the actual graph */
$this->annotation( $tPos,
( $this->amount * $this->yStepPixels ) + $this->yStepPixels,
$value['caption'] );
/* Draw the vertical line for this value */
$this->line( $pos, $this->amount * $this->yStepPixels, $pos, 0 );
/* Set the polyline coordinate for this line */
$this->polylineCoordinates[$key]['x'] = $pos ;
/* And the Y coordinate */
$this->polylineCoordinates[$key]['y'] =
$this->viewPortSize - $value['value'];
}
}
function createGraphLine()
{
/* Use transparent fill, otherwise polyline is filled with black */
$this->setFillColor( new ImagickPixel( "transparent" ) );
/* Stroke the polyline with red color*/
$this->setStrokeColor( new ImagickPixel( "red" ) );
/* Antialias the line */
$this->setStrokeAntialias( true );
/* Draw the polyline from the coordinates */
$this->polyLine( $this->polylineCoordinates );
}
}
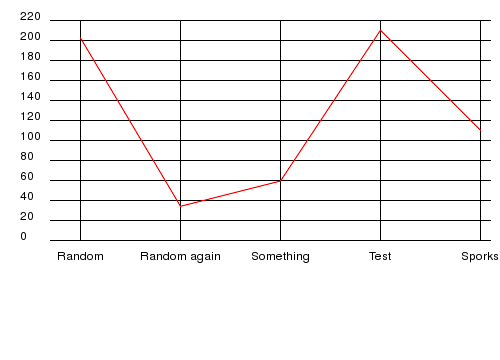
/* values to show in the graph */
$values = array (
array( "caption" => "Random", "value" => 202.54 ),
array( "caption" => "Random again", "value" => 34.2 ),
array( "caption" => "Something", "value" => 59.5 ),
array( "caption" => "Test", "value" => 210.34 ),
array( "caption" => "Sporks", "value" => 110.34 ),
);
try
{
/* Create a new graph */
$graph = new ImagickLineGraph( $values );
/* Initialize the canvas */
$canvas = new Imagick();
/* Create empty image */
$canvas->newImage( 500, $graph->maxValue + 150,
new ImagickPixel( "white" ) );
/* Set the image format to png */
$canvas->setImageFormat( "png" );
/* Render the graph on the canvas */
$canvas->drawImage( $graph );
}
catch ( Exception $e )
{
echo $e->getMessage();
die();
}
header( "Content-Type: image/png" );
echo $canvas;
?>
|